Attendings
Attendings · Dentists with parallel comp arcs
Contracts, insurance, and investing explainers tuned to medical timelines and liability realities.
$300K+
Avg. med school debt
43%
Physicians feel behind on retirement
15%
Physician disability rate
Net Pay Estimator
Illustrative$63,125
Federal
$24,640
State
$15,698
FICA
37%
Eff. Rate
Illustrative estimate only — not tax advice. Uses simplified 2025 federal brackets and estimated state effective rates. Verify with a licensed CPA or tax professional.
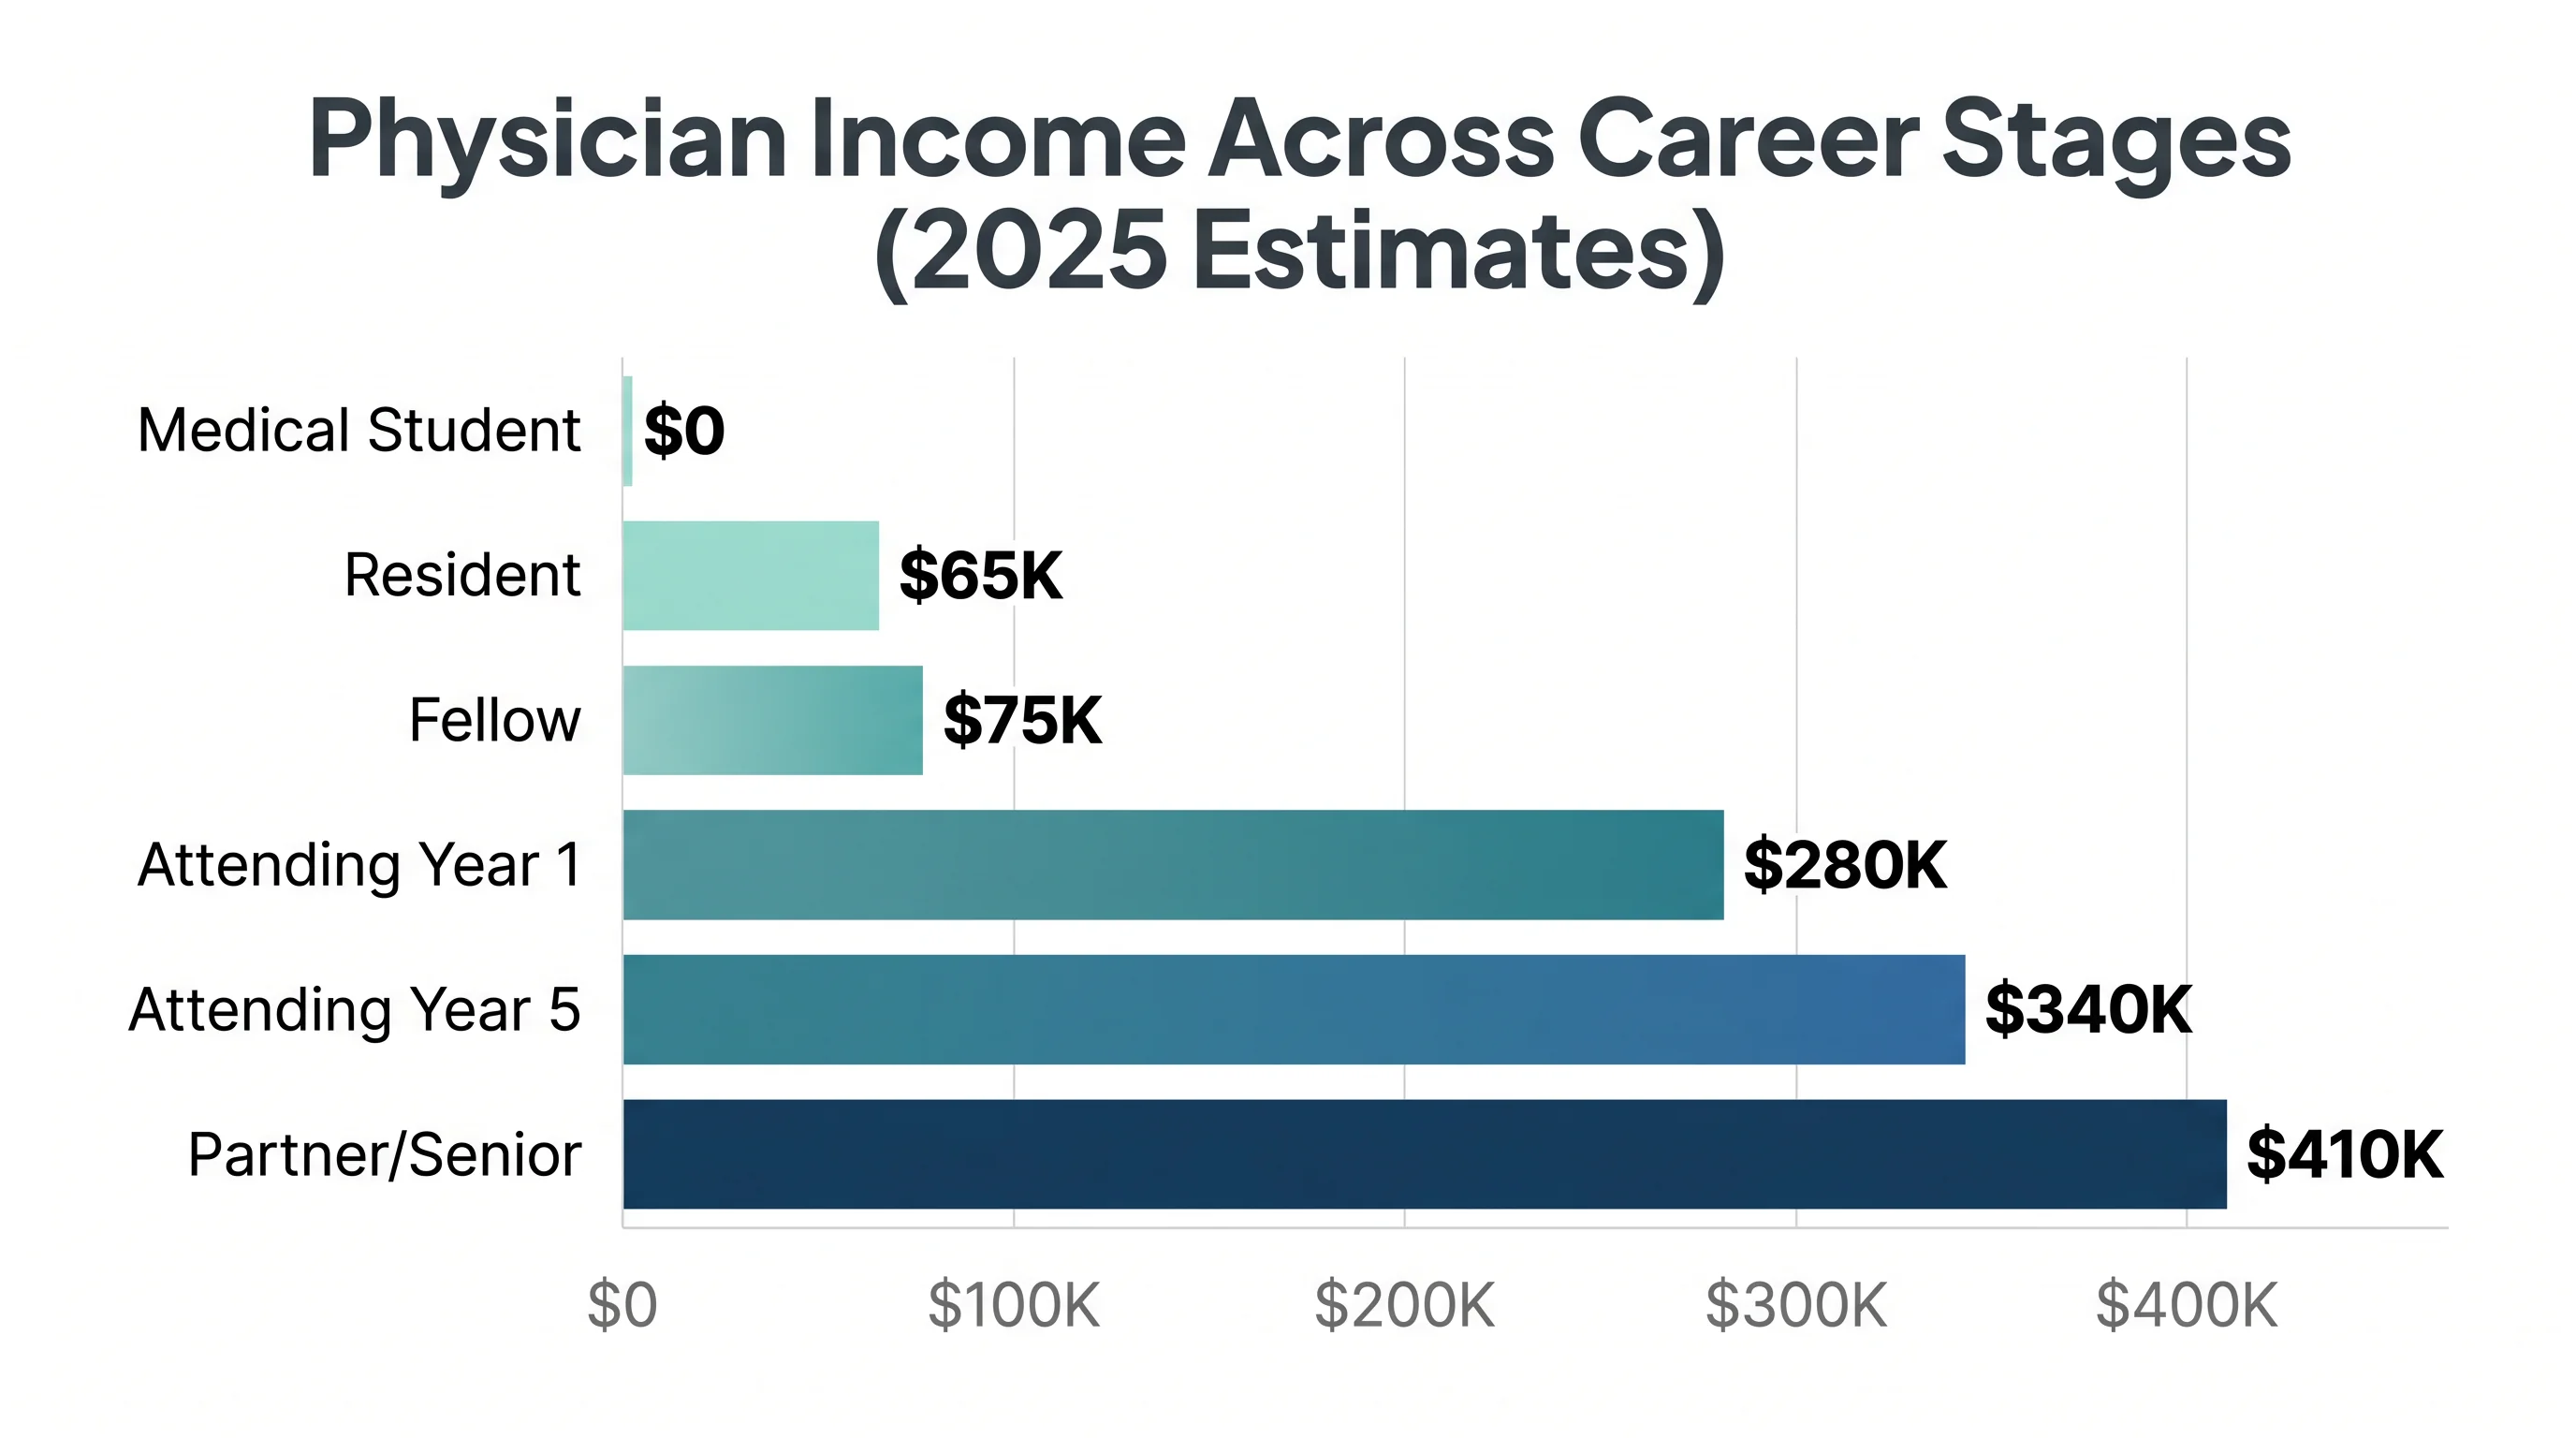
Physician income by career stage — bar chart — Illustrative. Not financial advice.
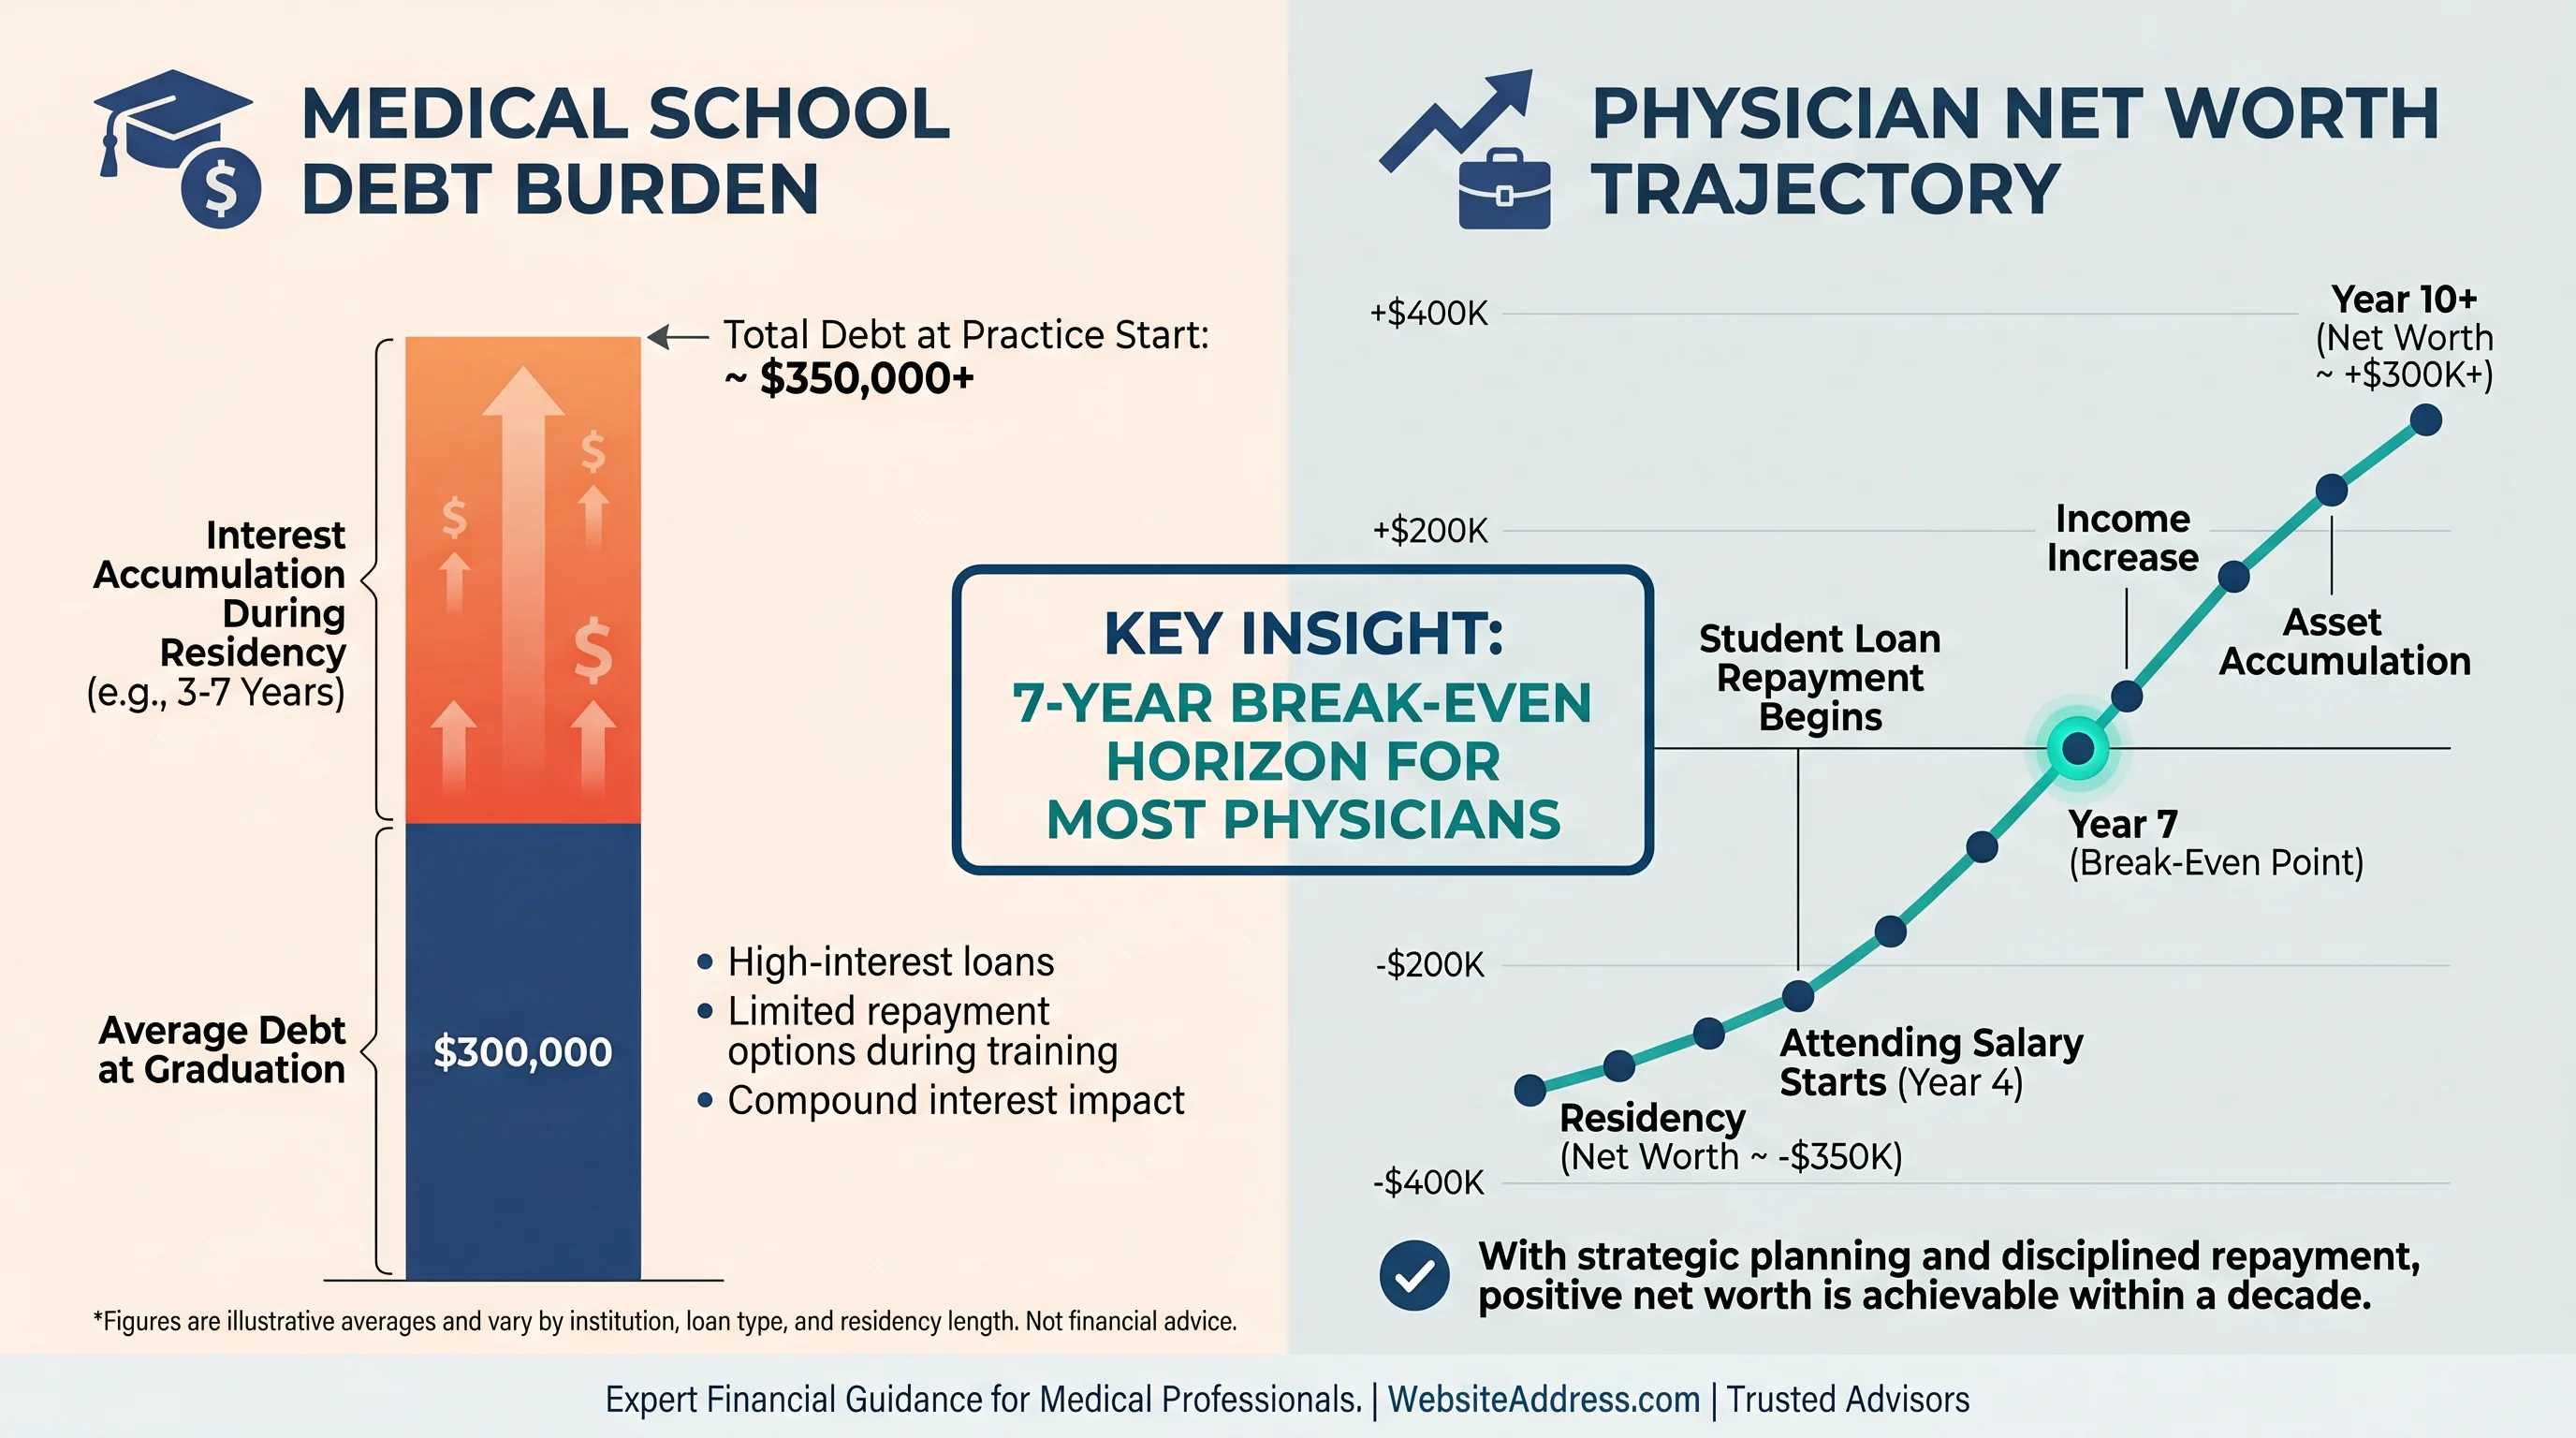
Physician debt vs net worth — 7-year break-even trajectory — Illustrative.
What We Cover
PSLF, income-driven repayment, and refinancing frameworks for medical debt
Tax-advantaged account prioritization for attending-level income
Own-occupation coverage analysis and gap identification
Backdoor Roth, 457(b), and defined benefit plan strategies
Employment vs independent contractor analysis, signing bonuses
Physician Retirement Planning
The wealth gap that opens during training years is real — but so is the catch-up potential when attending income accelerates. A retirement strategy built around your income trajectory can close that gap faster than any generic playbook.
Explore retirement planning tools
Practical guides and scenario tools for medicalfinance professionals — every article ships with a calculator or scenario box.
medicalfinancialadvisor.com respects training length, late wealth accumulation, liability consciousness, and contract churn. Coverage includes moonlighting taxes (general education), contract comparison frameworks, retirement catch-up for late starters, and insurance stacks without selling products. Calculators use clinical schedule assumptions as defaults. Tone is evidence-first, not lifestyle flex.
Attendings · Dentists with parallel comp arcs
Residents with moonlighting · NPs/PAs seeking planning literacy
Dual-physician households
In practice
Compress attending economics, contract literacy, insurance layers, and retirement catch-up into trustworthy articles and tools—monetized via ads + membership with optional $99 advisor onboarding. medicalfinancialadvisor.com respects training length, late wealth accumulation, liability consciousness, and contract churn. Coverage includes moonlighting taxes (general education), contract comparison frameworks, retiremen
Featured tools
medicalfinancialadvisor.com readers get calculators with assumptions, language, and examples native to their career — purpose-built for this desk, not relabeled consumer-finance tools.
Interactive
medicalfinancialadvisor.com readers get calculators with assumptions, language, and examples native to their career — purpose-built for this desk, not relabeled consumer-finance tools.
Future value
$1,185,264
Projected ending balance under the current compounding path.
Your contributions
$460,000
Starting capital plus every monthly contribution.
Investment growth
$725,264
The share created by compounding instead of deposits.
Output path
The line updates immediately as you change the assumptions.
Year 0 to Year 20
Interactive
medicalfinancialadvisor.com readers get calculators with assumptions, language, and examples native to their career — purpose-built for this desk, not relabeled consumer-finance tools.
Enter current and target weights. The model normalizes them to 100% and flags any sleeve that sits outside your drift band.
equities
fixed Income
alternatives
cash
Largest sleeve
55%
Anything too dominant deserves extra governance.
Effective sleeves
2.6
A lower value means the portfolio behaves like fewer real bets.
Concentration score
0.39
Herfindahl-style concentration across the current weights.
equities
Current 55% vs target 60%
Drift: -5%. Keep this sleeve within +/-5% to stay inside the current policy.
fixed Income
Current 25% vs target 20%
Drift: 5%. Keep this sleeve within +/-5% to stay inside the current policy.
alternatives
Current 10% vs target 10%
Drift: 0%. Keep this sleeve within +/-5% to stay inside the current policy.
cash
Current 10% vs target 10%
Drift: 0%. Keep this sleeve within +/-5% to stay inside the current policy.
Interactive
medicalfinancialadvisor.com readers get calculators with assumptions, language, and examples native to their career — purpose-built for this desk, not relabeled consumer-finance tools.
Nominal balance
$3M
Raw dollars at the retirement start date.
Today's dollars
$2M
Inflation-adjusted view of the same future balance.
4% rule estimate
$130K
A quick annual draw estimate before tax planning.
Output path
The line updates immediately as you change the assumptions.
42 to 65
Sustainable real income
$112K
Approximate annual spending in today's dollars if the portfolio must last through retirement.
Membership
Reader
$0
Member
$4.99/month
Optional advisory
$99 intake
FAQ
Finance desk that understands white coats, night shifts, and delayed net worth ramps—without sounding like a drug ad.
No. Materials are general education and illustration. Decisions involving securities, taxes, or planning should involve your own licensed professionals.
Remove ads and keep sessions focused for $4.99/month; premium modules roll in over time per roadmap.
Licensing disclosures; Niche-specific limitations; Privacy
Practical guides and scenario tools for medicalfinance professionals — every article ships with a calculator or scenario box.
Contact
Standalone physician brand. Its voice, design, and content arc are built around training length, attending economics, liability consciousness, and contract churn.
Between loan strategy, late career start, and high-income compression, physicians face unique wealth-building challenges. Fenul Wealth models every variable with clinical precision.
Opens fenulwealthmanagement.com · General education only · No fiduciary relationship formed on this page